عضویت
عضویت  ورود اعضا
 راهنمای خرید


Light Test & Measurement Instruments0 pages

Light Test & Measurement Instruments
Laser Power/Energy Monitor
Optical
Mounts
Translation &
Rotation
Stages
7
Motorised
Positioners &
Controllers
8
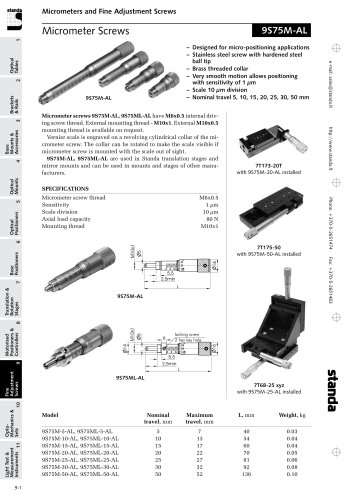
Fine
Adjustment
Screws
9
OptoMechanics &
Sets
10
Light Test &
Light Test &
Measurement
Measurement
Instruments
Instruments 11
General specifications
Digital Display Sizet
112.9 x 84.7 mm LCD t
640 x 480 pixels
Data DisplaytReal Time, Scope, Statistics,
t
Digital Tuning Needle and Averaging
Analog Outputt
0-1 Volt, Full Scale, ±0.5 %
Serial Commands Viat USB (standard), Ethernet or
tRS-232 (on special request)
Internet Upgrades Viat
USB key
Data Storage Viat
USB key
Dimensionst
210W x 122H x 45D mm
Weight (With Batteries)t
0.67 kg
Battery Typet
4 x Rechargeable 1.2 V Ni-MH AA
Battery Lifet
6.5 hours
External Power Supplyt
100/240 VAC 50-60 Hz
t
to 9 VDC 1.66 A
6
Energy meter specifications
Energy Ranget
10 fJ to 30 kJ
Monitor Accuracyt
±1 % best scale
Software Trigger Levelt
0.1 to 99.9 %, 0.1 %
resolution, default 2 %
Repetition Ratet
2 000 Hz / 10 000 Hz
t
in sampling
Real Time Data Transfer
(To USB key)t
2 000 Hz
Statisticst
Current Value, Max, Min,
t
Average, Std Dev., RMS & PTP Stability,
t
Pulse #, Rep. Rate and Avg Power
Detector Compatibility
Thermopilet
Average Power & Single Shot Energy
Photo Detectort
Average Power
Pyroelectrict
Pulse Energy
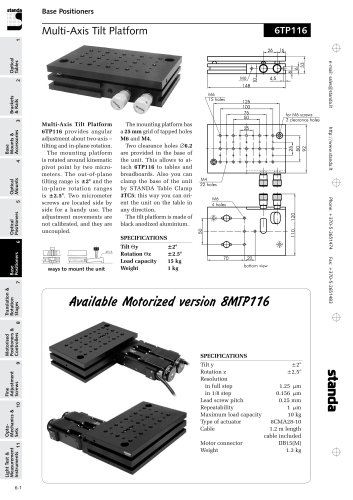
Base
Positioners
Power meter specifications
Power Range
Thermopilet
1 µW to 30 kW
Photo Detectort
4 pW to 3 W
Monitor Accuracyt
0.25 % ± 5 µV best scale
Statisticst
Current Value, Max, Min,
t
Average, Standard Deviation,
tRMS & PTP Stability, Time
5
MODELt11MAESTRO
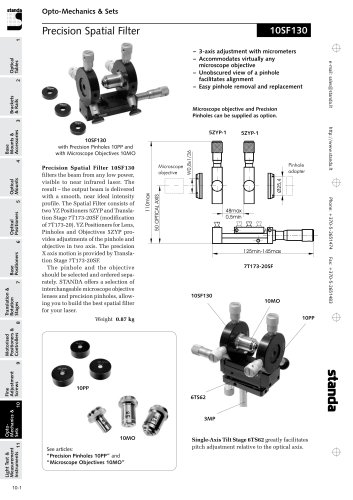
Optical
Positioners
Compatible with all 11PMK-H5,
11PMK-W5, 11XLP12-3S-H2 laser
power detectors, 11PD photo detectors and 11QE laser energy detectors.
4
AVERAGING DISPLAY
This very unique mode is perfect to
show the trend of a laser over time.
Set the number of points per batch
and let the Maestro identify the minimum and maximum values of every
batch. A yellow curve then follows
the average of each batch, displayed
as bars on the screen. The wider the
difference between the white and
blue portions of a bar (corresponding
to the min and max values), the more
unstable your laser is.
• Calculates the min, max and average values of batches of measurements
• Perfect to check laser stability over
time
Online datasheets are available. Please, visit us at www.standa.lt
e-mail: sales@standa.ltt
choose to display the latest min and
max values on the screen, with corresding numerical values displayed
in the uppper left corner.
• Ultra-fast readings (great for tuning)
• min and max hold
3
NEEDLE DISPLAY
Exactly like an analog needle, only
faster! This mode is particularly useful when tuning a laser. You can also
Base
Mounts &
Accessories
SCOPE DISPLAY
With it's line filling from the right
of the screen, this display mode is
a good approximation of an actual
oscilloscope reading. Settings include
time (x-axis) and range (y-axis). Basic
statistics (min, max and average)
can also be displayed directly on the
screen.
• Fully customizable x and y axis
• Fast update rate
2
REAL TIME DISPLAY
This display shows the measured
value in real time, with a corresponding bar graph below. The large size
of the digits and high contrast of the
graphics allows to see the measurement from a good distance. This
mode is also always present in dual
screen mode, in the upper portion of
the screen.
• Very Large Digits
• Bargraph
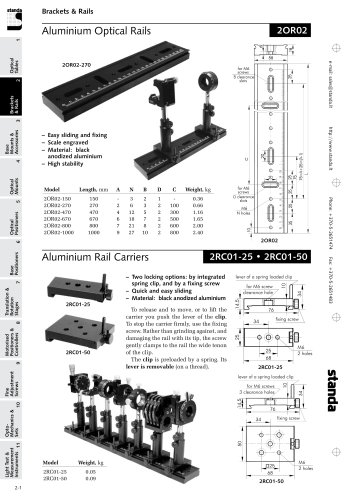
Brackets
& Rails
http://www.standa.lt
–t Reads all Detector Types: Thermopile,
photo and pyroelectric detectors
–t Large 5.6" Touch Screen Color LCD Display
–t Unique Ergonomic Design
–t Intuitive User Interface with Single or Dual Graph Display,
Instant access to the main function, Function Search tool
features
–t USB Key Access Store data directly on a USB key
–t Real-Time Statistical Functions
–t USB Key, Analog Output, RS-232, PC-USB, Ethernet Outputs
1
Fax: +370-5-2651483
Optical
Tables
Phone: +370-5-2651474t
11MAESTRO
11-1
"